Overview
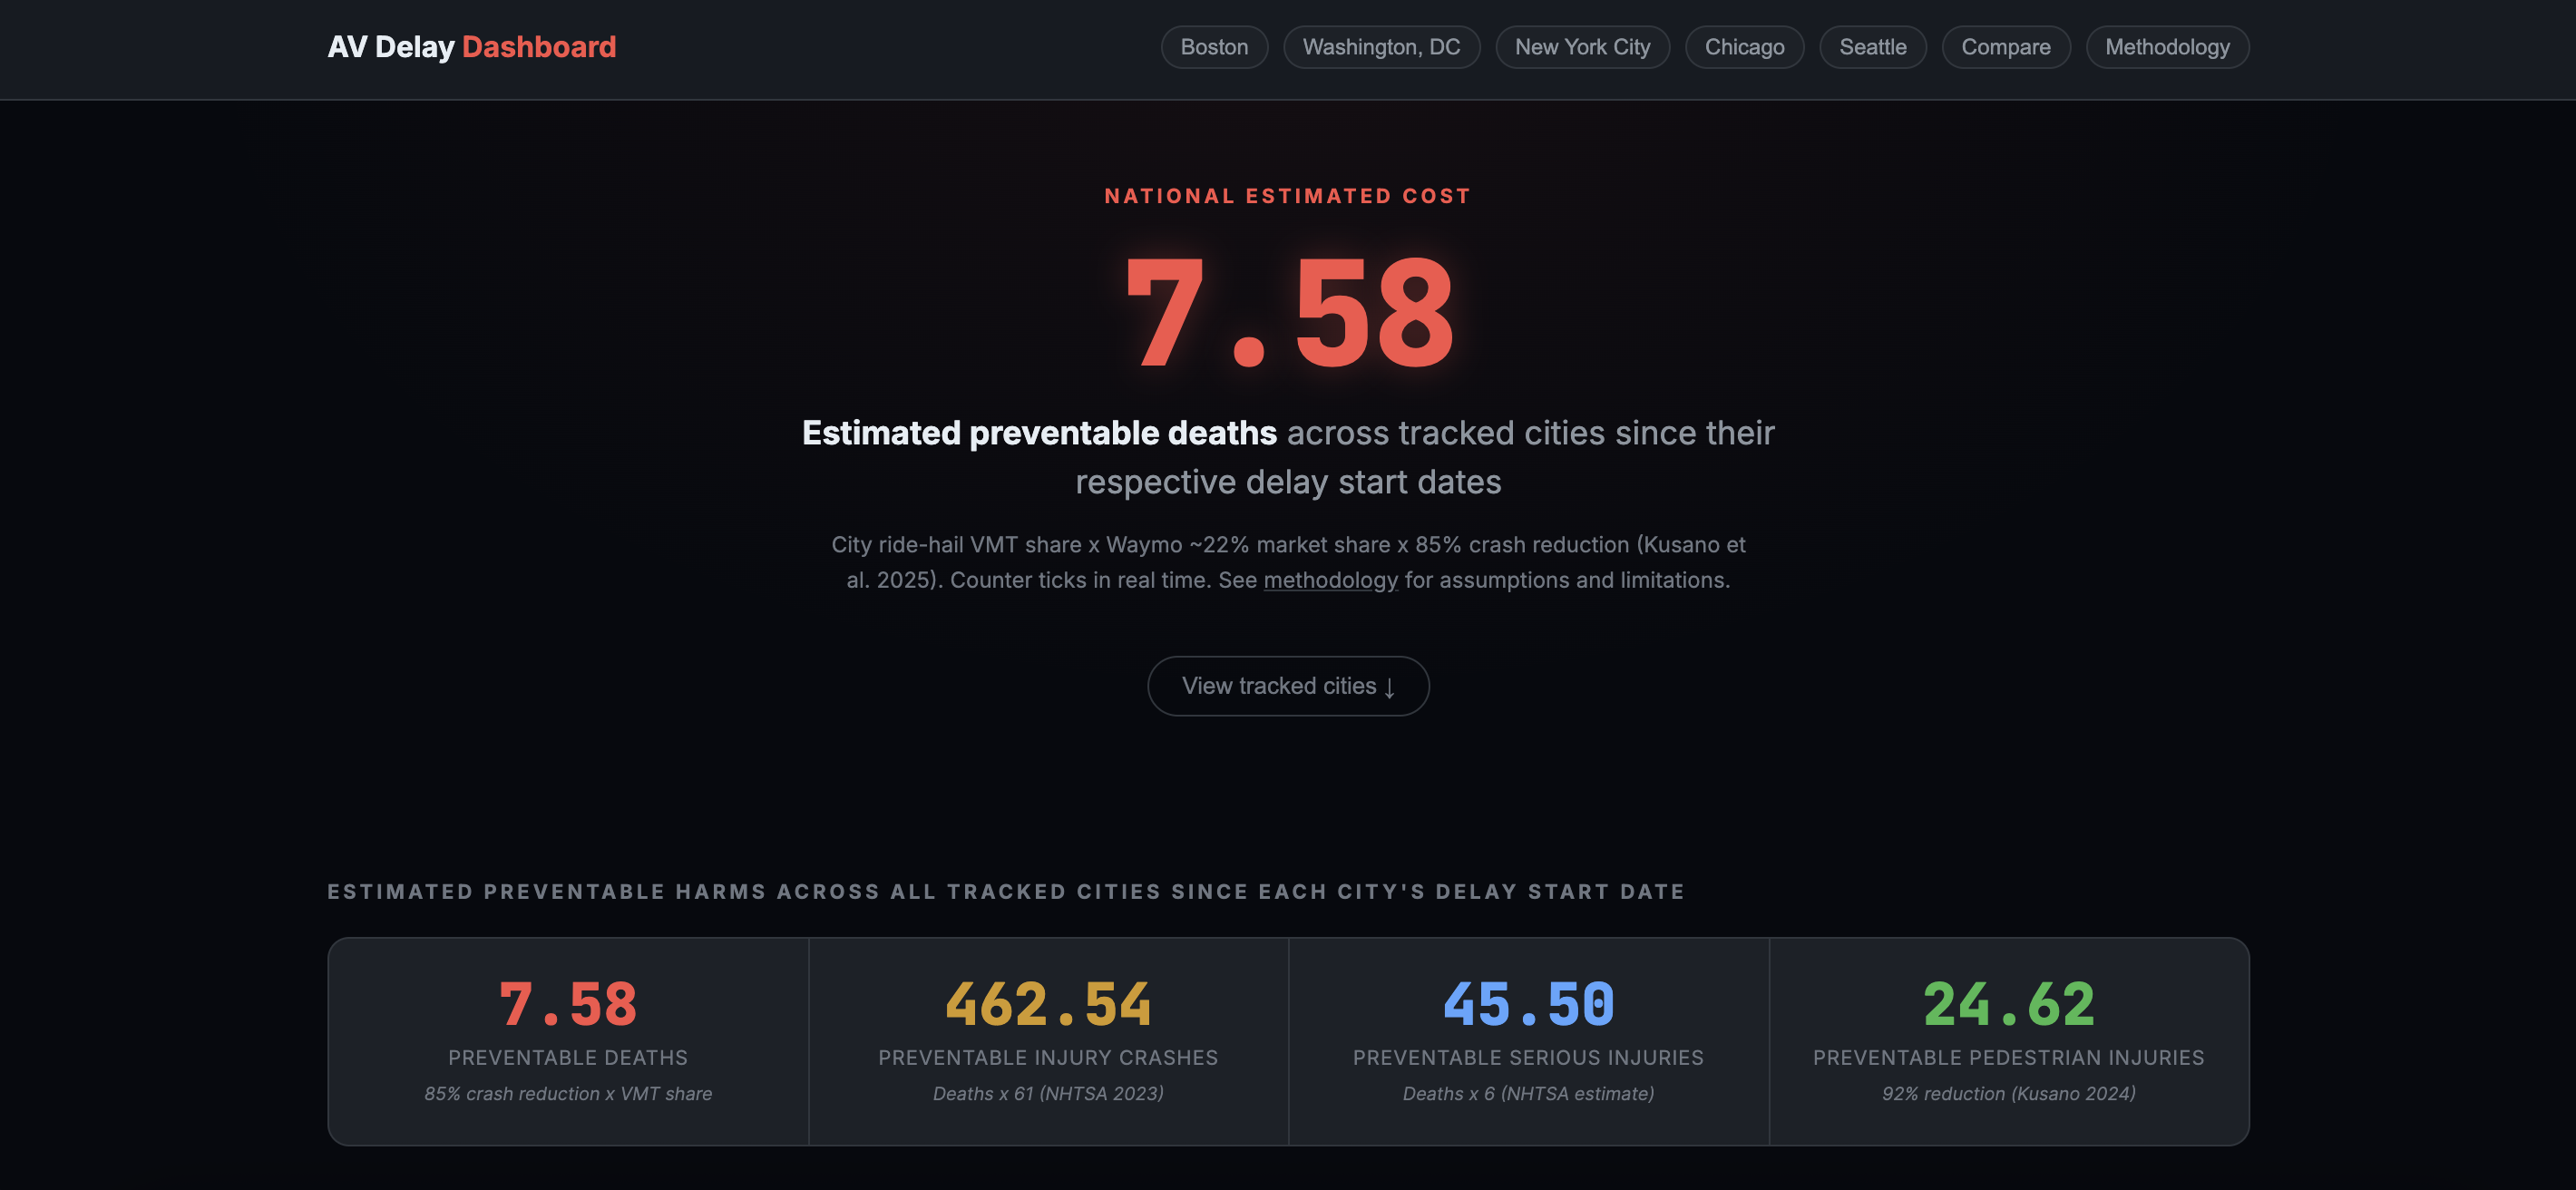
AV Policy Watch tracks the human cost of regulatory inaction blocking autonomous vehicle deployment in major US cities. Inspired by the DC Waymo Dashboard, it applies peer-reviewed Waymo safety data (Kusano et al. 2025: 85% fewer serious injury crashes over 56.7M miles) to local traffic fatality records to estimate how many deaths and injuries could have been prevented if cities like Boston, NYC, Chicago, Seattle, and DC had allowed AV service to launch.
Each city gets a full profile with a regulatory timeline, legislation tracker, cast of blockers and supporters, and a real-time animated counter ticking up as time passes. A companion Python bot running on Railway monitors crash news, posts daily city counters, and engages with AV policy accounts on Twitter, all with Claude-generated, compassionate, data-driven copy.
The project is transparent about its methodology and limitations: every figure is tied to a cited source (NHTSA FARS, Fehr & Peers 2019 ride-hail VMT data, YipitData market share), and each city page includes an honest "challenges" section acknowledging uncertainty.
Key features
- Real-time animated counter for preventable deaths and injuries (national + per city)
- City profiles with regulatory timelines, legislation tracker, and blocker/supporter grids
- Interactive charts: fatality trends, time-to-launch comparisons, safety benchmarks
- Deployment scenario modeling (conservative to broad autonomous adoption)
- Operational city comparison showing where AVs already run
- Full methodology and data source transparency section
- Automated Twitter bot: crash news scanner, daily city counter tweets, policy engagement replies
- Claude API integration for compassionate, factual tweet generation